A picture plus the words
An explanatory picture beside the words helps people grasp the point, and a decorative image is a different object.
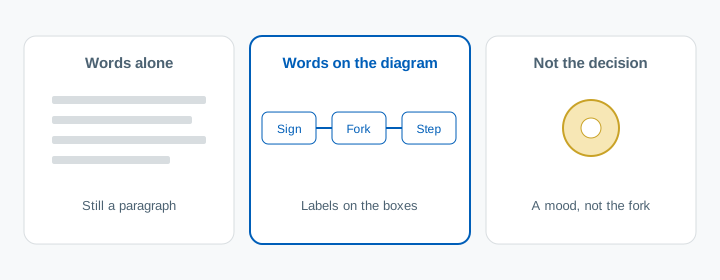
A briefing slide is often a paragraph. The pathway, the escalation, the three steps of the procedure, written out in full. People can follow it while it is on the screen. The thing they have to do later is a shape: this sign, this fork, this action. The paragraph still has that shape trapped in the sentences.
What the evidence says
Two names point at the same move. Dual coding is the claim that a point held as words and as a picture has two routes back. The multimedia principle is the teaching version: people learn more from words and a picture than from the words alone.
The broad reading evidence is smaller than the slogan, and it is real. Guo, Zhang, Wright and McTigue meta-analysed 39 experiments published between 1985 and 2018, 2,103 readers in all, comparing a text plus a graphic with the same text alone. Comprehension favoured the graphic, Hedges' g = 0.39 (95% confidence interval 0.26 to 0.51). A trim-and-fill check for missing studies lowered that to 0.28, and it was still reliable. Grade did not change the result in a way they could trust. Adults, coded as college and above, were the reference group. Primary and secondary readers were not reliably different from them. This is reading comprehension, much of it with college readers. It is not a measured effect on a ward round. It is the pooled test of adding the picture.
Those graphics were made for the passage. Guo and colleagues warn that a typical page is denser, and the pictures weaker. Only six of the studies used text from an actual textbook. Expect less from a slide that collected images on the way to the room. They found no reliable winner among pictures, pictorial diagrams and flow diagrams. Flow diagrams on their own still helped (g = 0.35). What did worse was a mix of graphic types on the same text. One diagram of the decision carries the benefit. A collage spends it.
The check you use changes what you will see. Short-answer tests, and tests that mixed formats, showed larger effects than true-or-false. The short-answer contrast against true-or-false was β = 0.58. Guo and colleagues give two readings, and both matter in a teaching room. True-or-false is easy to guess, so a real difference shrinks. A diagram is also often doing conceptual work, and a tick on a sentence can miss it. A close made of true-or-false items can make a useless picture look fine.
Mayer's 2017 review of computer-based lessons states the same principle and a much larger figure: a median d = 1.67 across five comparisons of words-and-graphics against words alone. That figure is the one in the abstract of his review. It is his set of comparisons, not Guo's pool. He also notes that several of these design effects are stronger for people who do not yet know the material. Treat 1.67 as the top of a tight lesson. Treat 0.39 as the average across a wider set of texts.
The picture still has to be designed. Noetel, Griffith, Delaney and colleagues overviewed 29 reviews in 2022, covering 1,189 studies and 78,177 participants. Eleven design principles had a positive meta-analytic effect on learning. The largest benefits they name are captions on a second-language video, putting the words and the picture together in space and time, and signalling the part that matters. Taking out interesting extras — they group this with the coherence principle — sits in the set they describe as robust. The same overview says good design matters more when the material is complex, and more in a lecture, where you set the pace, than on a page someone can reread. A briefing is the first of those rooms.
The interesting extra has its own name. Sundararajan and Adesope's 2020 meta-analysis reports that seductive details, material that is interesting and is not the point, can hinder learning. Their abstract is plain that the size of that effect depends on the image, how it is delivered, the subject, whether the learner sets the pace, the kind of recall question, and whether anyone checked that the detail was actually beside the point. A stock photo of a team around a bed is in that family when the teaching point is a decision fork. It gives the slide a mood. It does not store the fork.
Asking people to make the picture is a separate result, and it has a boundary. Fiorella and Zhang reviewed 14 studies, 17 experiments, in which people drew while reading a science text. Against reading only, or against a text strategy such as summarising, drawing helped: a mean d = 0.46 on comprehension across 12 comparisons, and d = 0.70 on transfer across 15. Against an illustration the instructor provided, comprehension still favoured drawing on average (d = 0.45 across 6 comparisons) and transfer was flat (d = 0.04 across 11 comparisons). Drawing also takes longer, and a sketch with no support can add load rather than remove it. The comparisons that looked most useful were the ones in which people set their drawing next to a provided illustration and revised it. That is feedback. It is a reason to show your diagram after the attempt.
What to do in the last five minutes
The diagram belongs earlier, while you are teaching the decision. The last five minutes are where you find out whether anyone can rebuild it.
- Leave one diagram of the decision you would worry about if it were missing. Put the words on the boxes. One graphic, of one kind.
- Take it off the screen. Ask for the shape from memory: the next box, or a sketch of the fork. Silence is an answer.
- Put the diagram back. People compare and correct. The sketch was the attempt. Your diagram is the answer.
- If they are new to this, give them the boxes and ask for the missing label. A blank page and no model is the unsupported sketch, and that is the version Fiorella and Zhang found unreliable against a clear illustration.
- Leave true-or-false off the close. Ask for the relationship the diagram was drawn to hold.
A short quiz on that unlabelled step is the same close. WrapUp Quiz runs it with the notes shut. One question on the fork is enough when the session was one fork.
What this does not mean
It does not mean a picture in place of the words. The comparison that worked was words plus a graphic, against the words alone.
It does not mean any image. A decorative picture is the seductive-details case. Sundararajan and Adesope reviewed interesting material that is not the teaching point.
It does not mean a slide of mixed charts. Guo and colleagues found that mix weaker than pictures, and they found no prize for a photograph over a flow diagram. Draw the decision. Stop there.
It does not mean people should draw and you should stop showing diagrams. On transfer, drawing did not beat a provided illustration. Show the diagram. Use the sketch as the attempt, then the diagram as the correction.
It does not mean a true-or-false item will detect a bad picture. That format was where the graphic effect was smallest, and guessing will hide a miss.
It does not sort the room into visual people and verbal people. These studies added a picture of the same point for everyone in the picture group. They did not match a picture to a stated preference.
It does not arrive with a ward-round effect size. Guo's pool is reading. Mayer's figure is five computer-based comparisons, reported in his abstract. Fiorella and Zhang reviewed science texts. A briefing can use the same move. That use has not been given its own number here.
Sources
- Guo D, Zhang S, Wright KL, McTigue EM. Do you get the picture? A meta-analysis of the effect of graphics on reading comprehension. AERA Open. 2020;6(1):1-20.
- Mayer RE. Using multimedia for e-learning. Journal of Computer Assisted Learning. 2017;33(5):403-423.
- Noetel M, Griffith S, Delaney O, Harris NR, Sanders T, Parker P, del Pozo Cruz B, Lonsdale C. Multimedia design for learning: an overview of reviews with meta-meta-analysis. Review of Educational Research. 2022;92(3):413-454.
- Sundararajan N, Adesope O. Keep it coherent: a meta-analysis of the seductive details effect. Educational Psychology Review. 2020;32(3):707-734.
- Fiorella L, Zhang Q. Drawing boundary conditions for learning by drawing. Educational Psychology Review. 2018;30(3):1115-1137.
Questions people actually ask
Should I add a picture to the slide?
Add a picture of the point, beside the words for that point. Guo, Zhang, Wright and McTigue pooled 39 studies and 2,103 readers: text plus a graphic beat the same text alone, with an average effect of Hedges' g = 0.39. Grade level did not reliably change the result, and college readers were in the set. A picture chosen because the slide looked bare is a different object.
Is a diagram better than a photograph?
In that meta-analysis, pictures, pictorial diagrams and flow diagrams were not reliably different from each other. A flow diagram on its own still helped (g = 0.35). A mix of graphic types on the same text did worse than pictures. One diagram of the decision is enough.
Should people draw the diagram, or should I show it?
Show the diagram, and use a sketch as the attempt before it. Fiorella and Zhang found that drawing during a science text beat reading or summarising (comprehension d = 0.46 across 12 comparisons; transfer d = 0.70 across 15). Against a provided illustration, transfer was flat (d = 0.04 across 11 comparisons). Have people compare their sketch with your diagram and correct it.
Will a true-or-false question show whether the picture worked?
It is a weak test of this. Guo and colleagues found larger effects when the check was a short answer, or a mix of formats, than when it was true or false. A true-or-false item is easy to guess, and it often checks a sentence rather than the relationship the diagram was for. Ask for the next step, or for the label on a blank box.
Does an interesting extra picture help people stay with the session?
Interesting material that is not the point can get in the way. Sundararajan and Adesope report that these seductive details can hinder learning, and that the size of the harm depends on the image, the subject, the pace, and the test. Noetel and colleagues, pooling reviews of multimedia design, list removing those extras among the principles with support. A stock photo sets a mood. It does not give a second code of the decision.